
Opening Range Breakout for NinjaTrader 8
NSL Opening Range Breakout
Indicator + Strategy in one package.
High, Low, and Midpoint plotted automatically. Session reset every day.
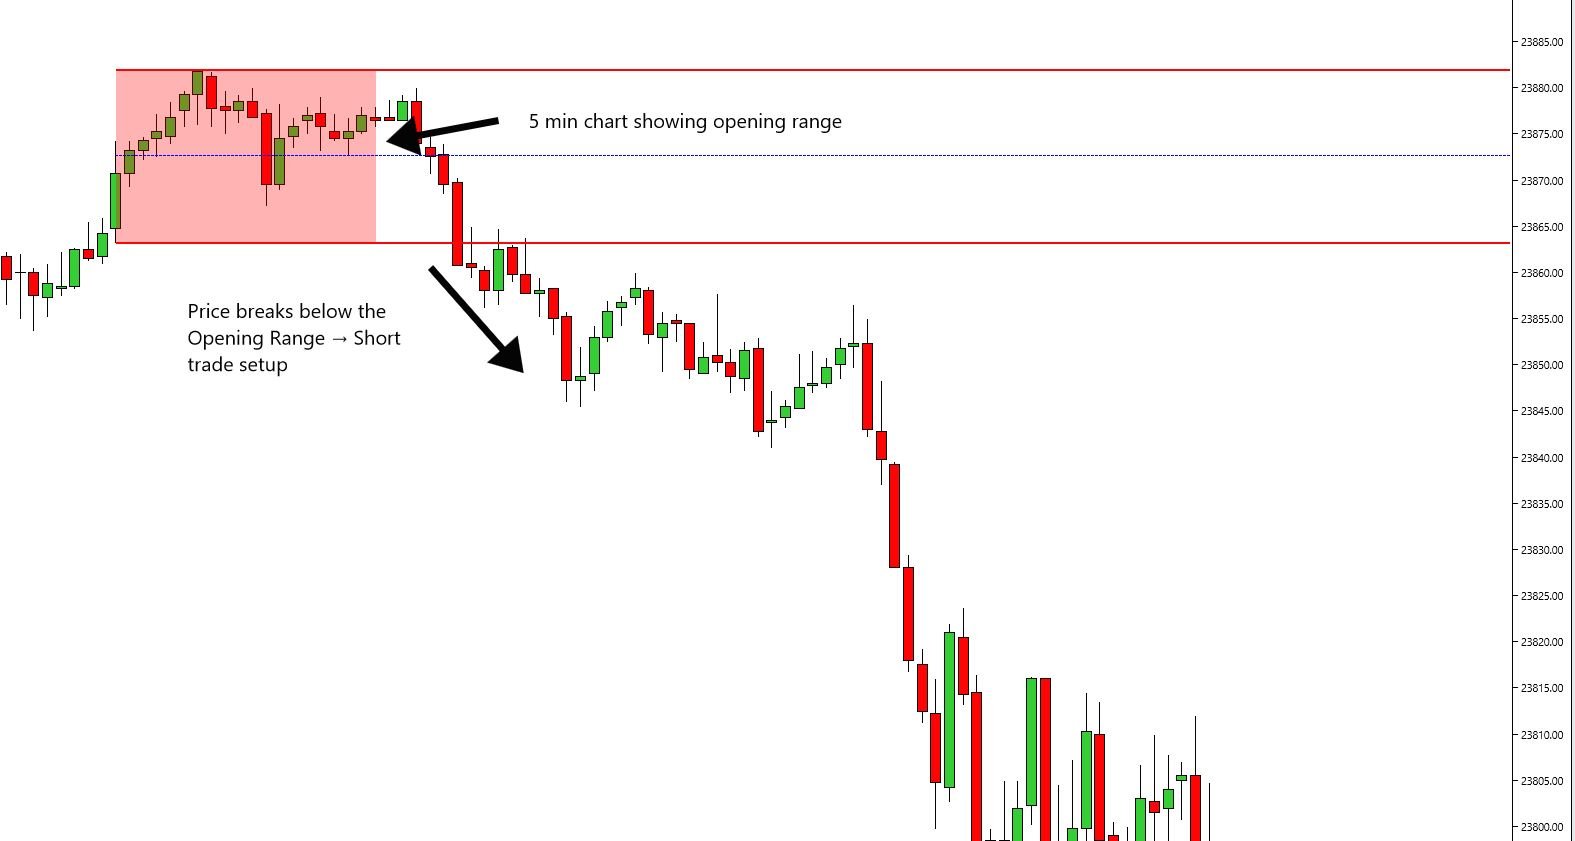
Define your time window (default 09:30–09:45), and the system draws the range box, the three level lines, and exposes the series for automated strategy use — all without manual input each session.
Fully functional trial — no credit card required — instant download
✔ One-Time Purchase ✔ Instant Download ✔ NT8 Compatible ✔ Direct Developer Support
Already decided?
Full license · Indicator + Strategy · 30-day money-back guarantee

3
Levels (High / Low / Mid)
15 min
Default Window (configurable)
Auto
Session Reset Daily
2-in-1
Indicator + Strategy
Trading the Open Without a Reference
- The first 15 minutes set the day’s tone — but most traders miss the exact range boundary
- Manually drawing the box every morning introduces timing errors and wastes pre-market preparation time
- No midpoint reference means missing the first pullback-to-mid entry opportunity
- Wanting to automate ORB entries requires the range levels as accessible data series
NSL Opening Range Breakout plots all three levels automatically and exposes them for strategy automation.
How It Works
Three Outputs — One Time Window
Calculated on a 1-minute secondary data series for accuracy across all chart types.
Visual Output
Range Box + Three Lines
A transparent rectangle drawn over the opening range bars showing the exact time window. Three horizontal lines extend from the range end to the right edge of the chart.
- Opening Range High — solid line, box color
- Opening Range Low — solid line, box color
- Midpoint — dashed line, separate color
- Box — transparent fill, configurable opacity
Time Window
Configurable Start & End
Start and end times set using NinjaTrader’s time editor. Default window is 09:30–09:45 (15 minutes). Any window works — 5 minutes, 30 minutes, or the full first hour. The session resets on every new trading session automatically.
- Default start — 09:30 AM
- Default end — 09:45 AM
- Session counter — tracks multiple sessions per chart
- Reset trigger —
Bars.IsFirstBarOfSession
Strategy Integration
Exposed Data Series
All three levels are accessible as public Series<double> — readable by any NinjaScript strategy referencing this indicator. The included strategy version uses these to automate breakout entries above the high and below the low.
- OpeningRangeHighSeries — live high values
- OpeningRangeLowSeries — live low values
- OpeningRangeMidSeries — live midpoint values
- Strategy included — automated breakout trading
Under the Hood
How the Range Is Calculated
Accurate range detection across any primary chart type, using a secondary 1-minute data series.
Secondary 1-Minute Data Series
The indicator loads a secondary 1-minute bar series via AddDataSeries(BarsPeriodType.Minute, 1). Range calculations use Highs[0] and Lows[0] from this series — so the opening range is always calculated on 1-minute resolution regardless of what the primary chart is displaying.
True High/Low Across the Full Window
While price is inside the opening range time window, the indicator continuously compares each bar’s high and low against the running maximum and minimum. The result is the true range — not just the first bar’s values — covering every tick that prints between start and end time.
Midpoint Calculated Geometrically
Mid price = Low + (High − Low) / 2. This gives the exact center of the range — a common pullback and equilibrium reference used in ORB strategies. Plotted as a dashed line in a separate, configurable color.
Automatic Daily Reset
Each new session is detected via Bars.IsFirstBarOfSession. The session counter increments, the prior range values clear, and the drawing objects get new unique IDs — so multiple sessions coexist on the chart without overwriting each other. Each day’s range box and lines remain visible in history.
Comparison
How It Stacks Up
FAQ
Common Questions
What’s the difference between the indicator and strategy versions?
Both are included in the same download. The indicator version plots the levels and box on your chart for discretionary trading. The strategy version uses the same levels to automate breakout entries — entering long above the opening range high and short below the low.
Can I change the opening range time window?
Yes. The start and end times are configurable using NinjaTrader’s time editor. The default is 09:30–09:45 (15 minutes), but any window works — 5 minutes for scalpers, 30 or 60 minutes for wider range definitions.
Will this work on tick, volume, or range bar charts?
Yes. The indicator loads a secondary 1-minute data series internally — so range detection is always based on 1-minute resolution regardless of your primary chart type. The levels and box render correctly on any bar type.
Does the range persist across the full day or disappear after the window closes?
The levels persist for the remainder of the session as horizontal lines extending to the right edge of the chart. When a new session starts, the prior range remains visible in history and a new box/lines are drawn for the new session.
What markets does this work with?
Any instrument available in NinjaTrader 8 — futures, equities, forex, and crypto. Most commonly applied to ES, NQ, and equity instruments. The configurable window makes it adaptable to any session.
Is there a refund policy?
30-day money-back guarantee. If it doesn’t work for your setup or trading style, contact us within 30 days for a full refund — no questions asked.
Try It First
Download the 7-Day Free Trial
Indicator and strategy both included. No credit card required. Test it on your charts — then decide.
Fully functional trial | No credit card required | Instant download
✔ One-Time Purchase ✔ Instant Download ✔ NT8 Compatible ✔ Direct Developer Support
Tried it and ready to get the full license?
Full license · Indicator + Strategy · 30-day money-back guarantee
Additional Resources
NinjaTrader 8 only | Works on any intraday chart type | Windows PC